
1. Use Scientific Questionnaire Design
You probably already have a very good idea of what drives customer satisfaction. Customer service professionals can generally create surveys that, on the surface, might closely resemble those created by survey methodologists. However, the words generally, might, and closely are crucial. Familiarity with the day-to-day needs of customers can well inform the content of a survey, but even the best intentions can have unintended consequences on question design.
The nation’s only uniform, cross-industry measure of customer satisfaction is the American Customer Satisfaction Index (ACSI). CFI Group’s patented application of the ACSI technology determined the precise questions, phrasing, and scales to accurately measure customer satisfaction. Rigorous scientific testing and decades of empirical evidence enable this methodology to link satisfaction to financial performance; you don’t need to reinvent the wheel. Without training in the science (and art!) of survey design and writing, survey data will be unreliable and possibly invalid.
For example, a common survey mistake is to ask: “Did you find the agent knowledgeable and experienced?” While knowledge and experience may be important, by attempting to address both issues at once, this question fails to capture meaningful information for either. This error is called a ‘double-barreled’ question and should really be two questions.
Another complicated area of questionnaire design are response categories. If a survey asks how often you shop, what is wrong with the following response options: never, occasionally, sometimes, often, and regularly? The problem is that although these are natural answers, they have different meanings to different people. In the aggregate, “sometimes” is devoid of meaning. These response categories are too vague to be useful for analysis. A better, but perhaps counterintuitive, way to phrase response categories is on a mutually-exclusive, numerical scale, with the endpoints of a continuum anchored with text.
2. Define the Goal
Understanding how you will use survey results is critical to good survey design. Unfortunately, most surveys are fielded without clear research objectives. Setting objectives up front means thinking about how you want to analytically extract useful “information” from the data. It’s very easy to ask for one type of information when you really want another. Not thinking about this in the design phase may mean not being able to use the data once it has been collected to address the questions one wants to answer.
For example, when word gets out that the contact center is conducting a survey, various departments often request input. Marketing would like to add a question about promotions, Product Development wants to ask about packaging, and the Sales department has an idea for upselling at the end of the survey. Everyone has just one little question to add. Too often, the result is survey data that none of the stakeholders find useful.
Keep the survey focused on the goal. A clearly focused survey makes success more likely for several reasons. A focused survey better supports the desired analysis, allowing for deeper coverage of critical topics rather than shallow coverage of many. But most importantly, it respects the customer’s time and helps avoid respondent fatigue.
If the objective is to improve the contact center experience, survey questions should be limited to those interactions. Each question will serve a specific purpose and capture information that can be acted on and analyzed.
3. Keep IVR Surveys Short and Sweet
The more questions there are, the lower the completion rate. This is particularly true in an IVR context, where there is limited commitment to participate. Interacting with a machine quickly becomes tiresome, and it’s much easier to hang up on a machine than a live interviewer.
It’s more useful to measure survey length in terms of time, rather than the number of questions. How questions are phrased has a huge impact on the time it takes to administer a survey.
The goal is not completion rate per se, but to collect actionable information. While there are no hard and fast rules, post-call surveys of 2-3 minutes collect enough information to be useful, but not so much that respondents drop out.
A common mistake is to ask customers to rate the importance of each on the survey. The customer is first asked to rate the agent’s courtesy, and then again to rate the importance of courtesy. Aside from doubling the length of the survey, it is a flawed measure of what drives customer behavior, and does not help prioritize improvements.
4. Measure What Matters
What customers say is important is often different from what actually drives their business. CFI Group reveals an extreme example in airline safety.
If asked to rank characteristics of an airline by importance, every customer will agree that safety is the single most important function of an airline. However, safety is not the driving force behind airline choice. Using cause-and-effect analytics, CFI Group identifies what actually drives customers to choose a specific airline. Price, schedule, and loyalty programs have the most effect on ticket purchase—though none of these are more important than safety. Safety is a requirement, the minimum requirement, a price of entry into the market.
Safety is not the driving force behind ticket purchase, and knowing its importance doesn’t help influence customer behavior. A far better way to understand the drivers of customer satisfaction is to empirically pinpoint the elements of the customer experience that drive behavior, and predict the change in customer behavior that would result if these elements were improved. Cause-and-effect analytics will bring out the more salient implications of price, schedule, and loyalty programs and their impact on the airline customers choose.
5. Use the Right Scale
In order for managers to execute on survey results, measurement must be precise. Many firms want to report customer satisfaction in percentage terms (85% of our customers are satisfied, or, our customer satisfaction is 85%). This is a costly mistake. In statistical terms, the problem with top-box, or percentages, is that the resulting number has a large margin of error. Satisfaction (like intelligence) is not as simple as a binary ‘satisfied’ or ‘dissatisfied.’ Without a much greater investment in substantially larger sample sizes to reach the same level of precision as a mean score, the imprecision of percentages makes it impossible to compare across products, regions or outlets. With an approach like this, valuable information is lost in favor of simplicity.
How many scale points should there be in a customer satisfaction questionnaire? In order to use customer satisfaction data to make better business decisions, scales need granularity. A five-point scale isn’t enough. Even a seven-point scale is questionable. This is where customer satisfaction becomes counterintuitive, especially for those with statistical knowledge. Most things are normally distributed, and it makes statistical analysis a lot easier when they are. But customer satisfaction is not. It’s only when dissatisfied customers have nowhere else to go that we find a normal distribution.
The CFI Group’s patented application of the ACSI finds that a ten-point scale provides the precision and resolution necessary to link customer satisfaction to operations and financial performance. Scores are then converted to a 100-point scale for reporting and benchmarking purposes.
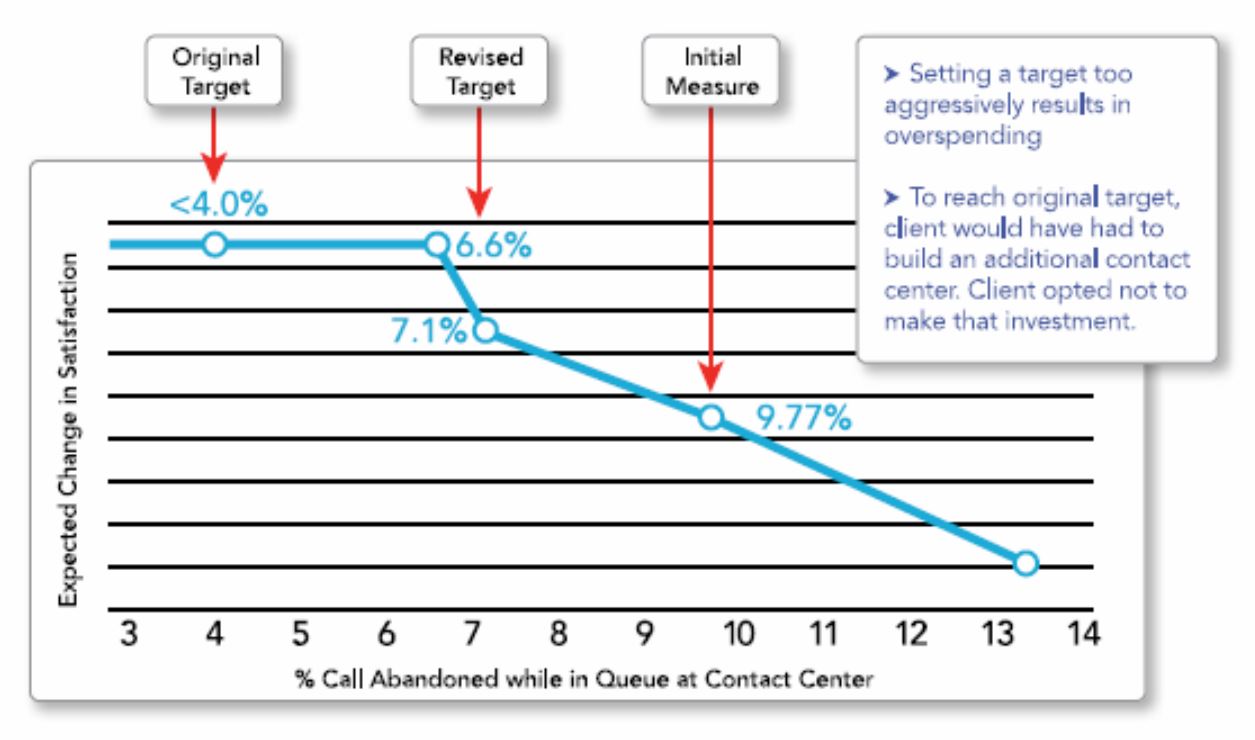
6. Don’t Strive for a Benchmark - Find the “Rightmark”
An effective customer satisfaction methodology is one that discerns profitable improvement initiatives from those that will divert resources from more important pursuits. “Rightmarking” is the integration of operational targets and customer satisfaction data to find the “sweet spot” where service and delivery converge. The “rightmark” is not the industry average, and not the average of the current best performers, but the target that makes your unique customer base happy. Knowing the exact point where service levels will most satisfy customers can prevent you from over or underinvesting.
One of CFI Group’s clients planned to build a new contact center in order to meet some very aggressive targets for abandonment rates set by the industry’s best-in-class. However, by using this client’s customer satisfaction metrics to calculate optimal service levels, it became clear that, for this individual company, the best-in-class target service level was overkill. Striving for the best-in-class benchmark would take valuable time, money, and effort, and this company’s customers were not going to reward that level of service.
The best-in-class goal didn’t make sense for this client’s customer base. It wasn’t their “rightmark.” Knowing this, the client was able to reallocate these resources to service improvements that really mattered to customers and profitability.
7. Coordinate with IT
Check with your IT department before you take this white paper and start to plan for your glorious future. While the operational data, customer usage, and demographics information exists, oftentimes getting at it falls in the lap of IT. They are going to need advanced warning, and you will need their buy-in.
Many company systems have been built up over time. As such, integration can be a challenge. This is the single biggest challenge to linkage modeling in our experience. Simple customer and representative IDs that allow one kind of data to be linked to another are quite often missing and take considerable IT investment to rectify.
It’s much better to involve IT up front in this process since success will be in teamwork with them. If you talk to IT before you “talk to the world,” you’ll get a better sense of what is possible in your environment, and how much effort will be involved.
8. Beware of Using Survey Results to Evaluate Individuals
Organizations that use survey results to punish performance are setting themselves up for failure. When people are punished or rewarded based on customer survey responses, they will find a way to thwart the process.
There is also a less obvious link back to scaling and precision. When top box percentages are used, the margin of error is often so large that it is not possible to discern good performance from bad performance. This opens the company up to legal action if compensation has been based on imprecise measurement.
One of our colleagues called the help desk of a large cell phone provider. At the end of the call, the agent told our colleague, “You’ll probably get a survey about this. Please give me a 5, or I could get fired. And remember, the survey is not about this company, it’s about me.” Needless to say, our colleague did not bother to participate.
In this same vein, agents should not have the responsibility of transferring a customer to the survey. This must be done automatically by the IVR system for immediate post-call surveys.
Feedback is most valuable when used in a positive way. Integrated tools like supervisory monitoring allow users to request real-time help, and supervisors can listen in and coach during an interaction. If the technology platform records surveyed calls, high-scoring agents can reveal best practices. A low-scoring agent can be monitored more closely and given additional training. In the future, coaching can be tailored to leverage survey findings, and address the issues most important to providing a good customer experience.
9. Report Often, and Make Results Accessible
Satisfaction data often lags the collection window by a month or more. But in the high volume, fast paced environment of the contact center, timing becomes even more important, and valuable information—and customers—can be lost in a short amount of time.
The more quickly survey results are available in the contact center, the greater the opportunity for action. Ideally, survey results are available immediately after the survey is completed. Additionally, the greater the option for dashboards, “heads-up” displays, and other types of real-time or near-time alerts, the better.
Often, satisfaction results are reported at a level too high to allow any meaningful action by the people looking to use the information to make better decisions. It is useful for managers to have access to continuous reporting, and to be able to look at key segments of interest, such as reason for calling, issue resolution, time/date range, product supported, and customer type.
Advanced reporting can provide insight into potential gaps between internal perceptions (how we think we performed) and external perceptions (how the customer thinks we performed) across key segments. This reporting, coupled with satisfaction by agent and trend data, enables managers to improve contact center performance in a much more meaningful way.
10. If You’ve Invested, Make It Work
Don’t lose sight of why you want to understand customer satisfaction: to improve business. Satisfaction analysis provides the roadmap to success. Left as a number in some annual report, it is an opportunity lost. You’ve spent the time and money to collect the data, now put it to work for you!
Other Resources
- Date
- December 12, 2017
center Description You probably already have a very good idea of what drives customer satisfaction. Customer service professionals can generally create surveys that, on the surface, […]- Date
- March 13, 2017
center How to Ensure Long-Term Profitability through Customer Satisfaction icon Description In today’s competitive marketplace, customer satisfaction is critical to long-term profitability. Customers whose needs and […]- Date
- March 13, 2017
center Description Applying the American Customer Satisfaction Index (ACSI) Technology to the Management of Government Services: Rationale, Rigor and Results The Government Performance and Results Act […]- Date
- March 12, 2017
center Description CFI Group Delivers American Customer Satisfaction Index (ACSI) Methodology: National Measure of Quality and Predictor of Corporate Performance Established in 1994, the American Customer […]


